What kind of image pops up in your head when you think of a productive developer? It’s not just someone feverishly typing on their keyboard and gazing at the computer screen for hours straight, right?
Developer productivity is so much more than the speed of work and the number of story points completed. And though performance timing and outputs do matter a lot in development projects, the ultimate level of one’s productivity can be measured and achieved only when other vital work-related factors are taken into account as well.
Wanna know what these factors are? The SPACE framework provides all the answers you need. Let’s explore what SPACE is about and how it helps to understand developer productivity in depth.
What Is the SPACE Framework?
SPACE is a recent invention. It was first introduced to the world in 2021 as part of The SPACE of Developer Productivity written by some of the greatest technology luminaries from GitHub and Microsoft Research.
The key idea behind the framework is that developer productivity cannot be measured using just one conventional metric (such as the number of issues tackled or coding mistakes made). To fully comprehend developer productivity and then do something about it, you need to consider a set of diverse factors that affect your performance.
Each letter in SPACE stands for one of these factors:
- Satisfaction and well-being – When we like our jobs, when we’re happy with our lives, and when we’re healthy, we naturally tend to be more productive. So, it’s useful to know how your team members perceive the workplace, whether they feel efficient, stay in a positive state of mind, or are on the verge of burnout. This information tells a great deal about developers’ personal productivity and helps to predict any declines in it.
- Performance – This dimension of developer productivity is concerned with the outcome of work. It’s about the overall impacts of certain processes and the quality of their results. For example, you can measure how reliable a piece of code is and the number of bugs it contains. Or you may analyze project costs and the level of customer satisfaction – they are the signs of good or bad team performance as well.
- Activity – To assess a developer’s activity, you need to identify what they did over a period of time and how many tasks they managed to complete. This includes every effort in software design, coding, testing, deployment, etc. Plus, such routine activities as daily standup meetings and brainstorming sessions must be taken into account as well. Not only do they consume a significant portion of developers’ working time but also are an intrinsic part of their professional lives. Hence, the picture of developer activity can’t be complete without them.
- Communication and collaboration – Another important thing that no software development team can do without is collaboration. So, the excellence of team communication and the speed of knowledge sharing also define developer productivity to a large degree. Of course, collaboration is not the easiest metric to measure, but you can go about this task by analyzing the quality of work reviews, the frequency of feedback given to developers, and the length of the onboarding period that new hires go through.
- Efficiency and flow – A workflow can be considered efficient when it’s free of frequent interruptions and produces high-quality performance results without any waste of resources. To measure your developer efficiency and flow, you need to see how many handoffs and distractions there are in your work process, how much time is used on different tasks, and how long it takes to pass them through one workflow stage to another (e.g., from code writing to testing and deployment).
SPACE Benefits
As you can see, the SPACE framework unites several crucial metrics under the same roof, so to speak. Hence, it provides a more accurate and comprehensive picture of developer productivity than any other conventional approach that applies merely one metric.
Another strength of this framework is in combining objective and subjective data:
- It requires you to keep an accurate count of resources invested in work, bugs, issues, workflow handoffs, etc.
- And besides, it makes you look into developers’ perceptions of their personal efficacy and job satisfaction.
By including both types of data in the view, the SPACE framework lets you analyze developer productivity in and out, understand what lowers it, and find evidence-based solutions for improvement.
15 Useful Metrics to Analyze Developer Productivity Under the SPACE Framework
Satisfaction and well-being:
1. Employee turnover
It is the rate at which an organization loses and replaces employees, either voluntarily or involuntarily. High turnover rates can point to underlying issues that are causing employees to leave, such as inadequate compensation, poor leadership, or a toxic work culture. Conversely, low turnover rates can reflect a healthy and positive work environment.
To calculate employee turnover for any period of choice, simply use this formula:
Find out more about measuring employee turnover here. 👈
2. Employee engagement
High employee engagement is a sign of a motivated and committed workforce, as well as the overall effectiveness of the management team.
The most common method of measuring employee engagement is through surveys. However, before creating one, you must define what employee engagement means to your organization. It could encompass such phenomena as work satisfaction, employee motivation, or commitment to the company’s mission, among others. The understanding of this core term will determine the type of questions you will include in your survey.
Aim to yield information about developers’ satisfaction with their jobs, workloads, sense of belonging to the team, and work-life balance. The questions should be specific, easy to understand, and relatable to your work environment.
Explore the factors contributing to higher employee engagement here. 👈
3. Absenteeism rate
Frequent employee absences tend to result in decreased productivity, reduced morale, and increased workload for the rest of the team. Keeping track of absenteeism can help you identify patterns, root causes, and trends that may be affecting workforce attendance and implement changes that can improve the situation and overall performance of your software developers.
To measure staff absenteeism, you need to collect data on employee absences using a high-quality tool like actiPLANS. Then, simply follow this formula:
Explore other benefits of collecting accurate time off data here. 👈
Performance:
1. Net Promoter Score (NPS)
NPS provides a quick and straightforward snapshot of how likely customers are to promote your business. It reflects the degree of their contentment and happiness with the products or services you offer.
The NPS score is calculated by subtracting the % of detractors from the % of promoters. Promoters are individuals who rate a company a 9 or 10 out of 10 in a satisfaction survey, while detractors are those who rate the company a 6 or below. Passives are customers who rate the company a 7 or 8. The percentage of passives is not considered in the NPS calculation.
The resulting score ranges from -100 to 100, where a positive score indicates more promoters than detractors and a negative score indicates the opposite. A score of 0 indicates an equal number of promoters and detractors.
You can use the obtained NPS score to benchmark yourself against peers in the software development industry and learn how to improve your customer satisfaction levels.
2. Code quality
Code quality is an essential aspect of a successful software development process. And measuring it is one of the best ways to evaluate developers’ performance.
The simplest way to go about this task is by adopting various automated code review tools that employ such metrics as code coverage, complexity, duplication, maintainability, and security to provide a comprehensive view of your code quality. For instance, tools like ESLint, SonarQube, and Code Climate can check for redundant code, code smell, and adherence to best practices in coding.
3. Cost of work
Measuring the cost of work allows you to assess the financial results of the completed project, plan for future ones, and improve overall resource allocation. To measure the cost of work, it is essential to track time put into work and analyze the collected data accurately.
With time tracking software like actiTIME, you have the flexibility to set different hourly rates for each developer. This allows you to accurately track staff-related expenses along with the time invested in work and understand how much each project and task costs.
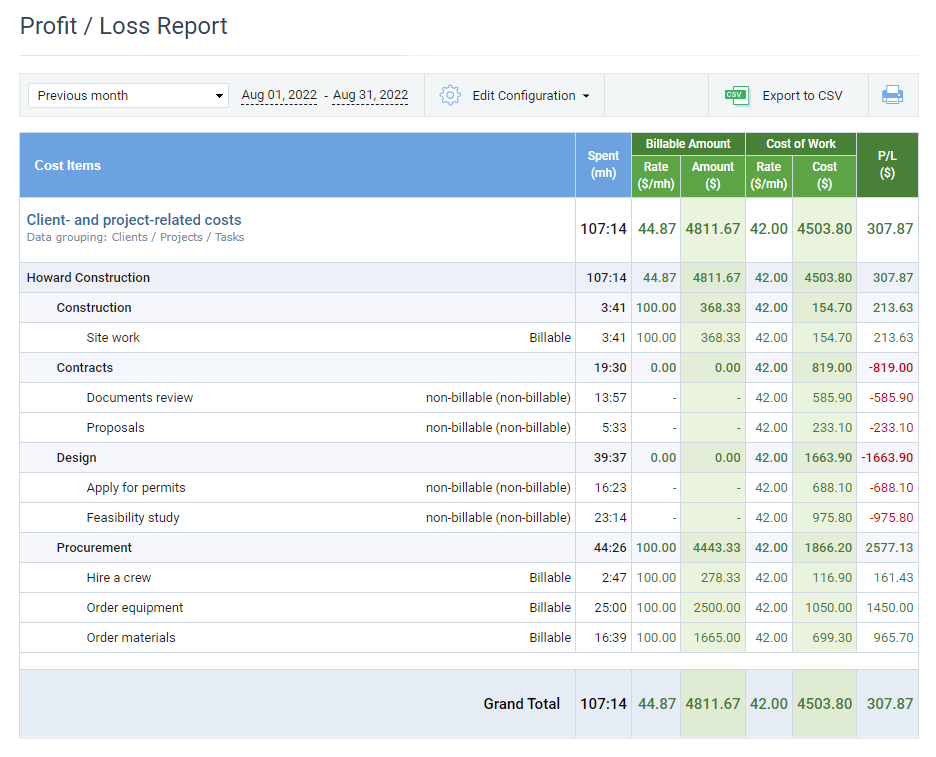
On top of that, actiTIME features the Profit / Loss Report that provides a detailed breakdown of billable hours spent on projects, the total expenses incurred, and the resulting profit or loss. This report enables you to measure the financial performance of your team, identify which projects are the most profitable, and make more informed productivity improvement decisions.
Find out more about cost tracking and analysis with actiTIME here. 👈
Activity:
1. Lines of code (LOC) written
This metric provides insight into how much work was done by an individual or team and how that work is distributed across different projects. However, it is important to note that LOC alone should not be used to make an assessment of developer productivity as this can lead to a focus on quantity over quality.
2. Issues resolved
The number of issues resolved reflects the degree of progress made in fixing any bugs, glitches, errors, and inconsistencies that arise during the software development process.
A high number of resolved issues indicates that the development team has dedicated efforts to correct and debug the software code, thus, reducing the possibility of problems in the final product. On the other hand, a low number of resolved issues may indicate that the development team is facing challenges in identifying and addressing the issues promptly, which can ultimately lead to project delays.
3. Sprints completed
The number of completed sprints gives an indication of how far the project has moved toward the end goal. The completion of sprints implies that the development team is making steady progress in delivering the product. It also gives an idea of the project’s momentum, which can help to anticipate potential delays and adjust plans accordingly.
Additionally, the number of completed sprints can help identify any issues or bottlenecks that may exist in the development process. For example, if the team is consistently taking longer to finish sprints than anticipated, it may indicate that there are problems with the project’s scope or planning. On the other hand, if the team is completing sprints more quickly than expected, it may indicate that the project’s goals are not ambitious enough, and additional objectives could be added to extend its scope.
Learn more about sprints and their role in the Scrum process here. 👈
Communication and collaboration:
1. Response time
This metric measures how quickly a developer responds to emails, calls, or messages or resolves the assigned issues. It shows how responsive your team members are and whether they’re effective communicators. A strong response time indicates that the team is actively engaged and available for collaboration.
To calculate the response time rate, one must first gather data on the total number of tasks or issues handled within a specific period. This may be done manually or through automated systems, such as call logs, chat records, or ticketing systems.
The next step is to calculate how long it took to complete all tasks or resolve all issues within the period. This includes the time taken to acknowledge the task or issue, the time taken to troubleshoot the problem, and the time taken to close the task or issue.
Finally, divide the total time taken by the total number of tasks or issues handled, and the result is the response time rate:
2. Collaboration frequency
The frequency of collaboration measures how often team members collaborate and communicate with one another. This metric shows whether developers are working together and sharing ideas well. Teams that collaborate frequently are more likely to identify problems and improve processes quickly, leading to better overall performance.
The collaboration rate is calculated by dividing the total number of collaborative activities or tasks completed by a team within a specific timeframe by the total number of tasks assigned. Collaborative activities can include brainstorming sessions, group meetings, joint problem-solving, collaborative decision-making, and cross-functional coordination.
High collaboration rates indicate that the team functions properly and accomplishes its objectives in a timely and efficient manner, while low rates may suggest that there are significant barriers to effective teamwork.
Find out how to promote collaboration in your development team here. 👈
Efficiency:
1. Time to Market (TTM)
TTM is one of the most critical efficiency metrics for software development projects. It measures the amount of time taken to release a product to the market. A shorter TTM is favorable as it means the software is introduced to the market faster, giving companies a competitive edge. Shorter TTM can be connected to increased revenue generation, provided that the software is of high quality.
To improve TTM, companies can implement Agile software development methodologies which help simplify processes, speed up iterations, and reduce the development time. The use of cloud computing, microservices, and continuous integration and delivery (CI/CD) pipelines can further enhance software delivery capabilities.
Learn more about Agile project management here. 👈
2. Defect density
This metric reveals the number of defects in a product per unit of size. By measuring it, you can identify and remedy errors that harm product quality.
The number of defects refers to the total number of defects found in the software application, while the size of the application is measured in LOC or function points (FP). Defect density is usually expressed as defects per kilo lines of code (KLOC) or defects per function point.
A higher defect density can is a sign of lower cost-efficiency since you need to fix more bugs. Customer satisfaction and company reputation could also be hurt due to the increased number of errors and malfunctions in the product.
To reduce defect density, you need to invest in early testing and quality assurance. Implementing CI/CD pipelines places a strong emphasis on quality as well. Besides, using automated testing tools during development cycles can reduce human errors and improve product outcomes.
3. Cost of delay
This efficiency metric helps to analyze the financial impact incurred due to the delay in delivering a product to the market. By being proactive in measuring it, you can reduce such risks as missed opportunities, lost revenue, and a decline in customer satisfaction, which are all associated with project delays.
The cost of delay formula takes into account the potential revenue or profit that could have been generated if the project was completed in a timely manner, as well as the cost of resources involved (i.e., labor, materials, equipment, etc.). The formula is typically expressed as follows:
4. Tasks completed on time
By measuring the number of tasks completed on time, developers can identify any process bottlenecks that make them less efficient and productive. For example, if a team consistently falls behind schedule on certain types of tasks, they may need to re-evaluate their approach to time estimation and work as such or allocate more resources to those tasks in the future.
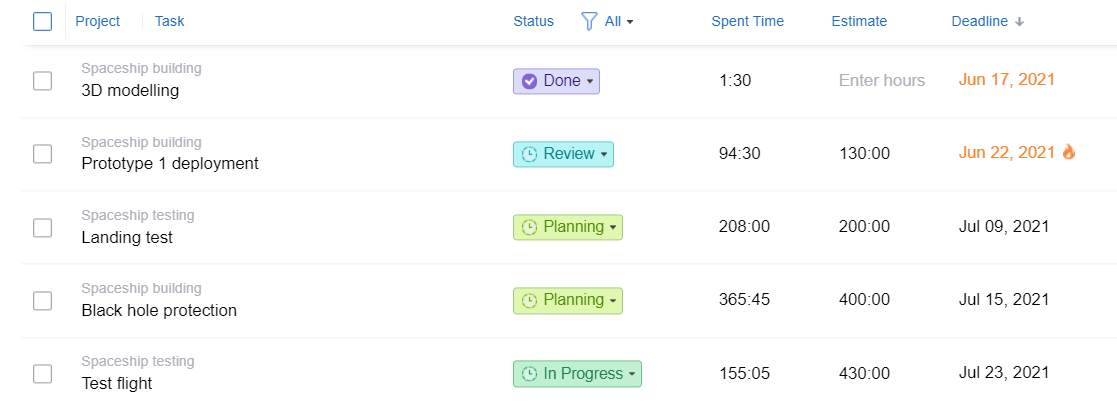
To help you measure the rate of success in completing tasks on time, actiTIME offers a visual estimate tracker and the Estimated vs. Actual Time Report.

The former feature allows developers to set time estimates for tasks and then track their progress toward that goal. This graphical representation of progress lets you stay motivated and focused, while also providing a clear picture of whether you’re meeting your deadlines.
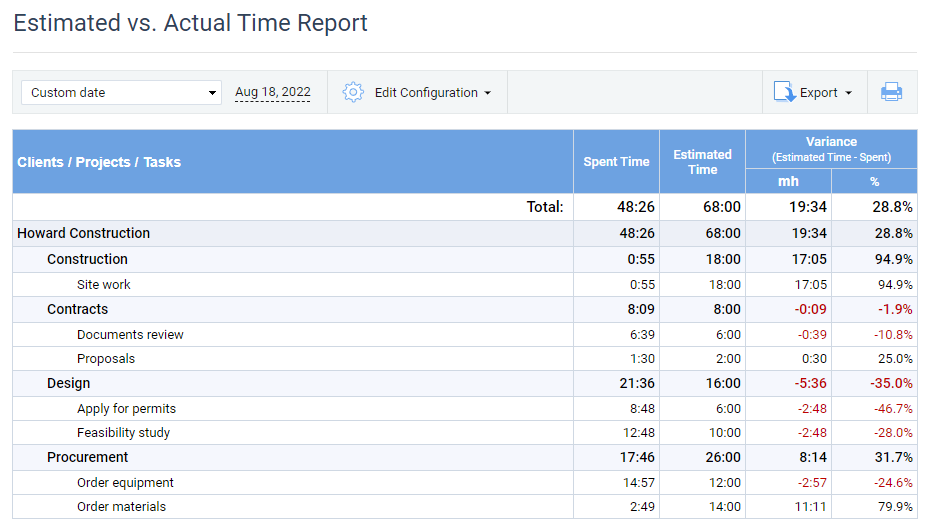
As for the Estimated vs. Actual Time Report, it simplifies the comparison of your initial time estimates with the actual time it took to complete tasks. By analyzing the data this way, developers can see if their productivity suffers and identify areas where they may be underestimating or overestimating their work and make adjustments accordingly.
Find out more about project estimation with actiTIME here. 👈
3 Tips on How to Use the SPACE Framework
Whether you work alone or as part of a team, the SPACE framework is definitely worth trying out. It can be implemented at both the individual and the collective levels. And in either case, it gives a profound insight into how productive you are as a solo professional or a collective.
Here are the three basic rules of using SPACE in practice:
1. Choose the right metrics
The inventors of the SPACE framework make it clear that analyzing multiple dimensions of productivity is beneficial. However, they also warn us of the confusion that may arise if you try to collect and analyze too many datasets at once.
As such, you don’t have to measure all the five SPACE dimensions of developer productivity at once – three at a time will be enough. So, pick the dimensions that make more sense to you at any current moment and decide which metric will help you evaluate each of them correctly. Just make sure at least one of the chosen measures is perceptual – the understanding of individual experiences of productivity rounds up and completes the picture.
For example:
If you already analyze time spent on different types of tasks (i.e., Efficiency), you may expand your view of productivity by understanding how your team members feel about their work (i.e., Satisfaction) and examining code reliability / uptime (i.e., Performance). The combination of these three metrics will help you correlate the speed and quality of developer outputs with their subjective attitudes and overall well-being.
2. Ensure your data is accurate
The only way to make that happen is by tracking developer performance consistently and utilizing effective data collection instruments – they must be chosen in line with your productivity analysis goals and capture the right types of information.
Some of the Efficiency, Performance, and Activity metrics of the SPACE framework can be easily measured with the help of project management software.
For instance, a tool like actiTIME allows users to keep a detailed log of all their project tasks and see how much time and money was spent on them. It lets you keep an accurate track of all the developer activities, including such obvious ones as coding and bug fixing, as well as the ones that are usually harder to trace (e.g., brainstorming and meetings). In summary, with actiTIME, you will always stay in the know of what your developers did throughout the project, how fast they worked, how much money they earned, and whether the set deadlines and estimates were met.
Perceptual metrics like Satisfaction require special consideration. Research findings indicate that the fear of punishment and a poor understanding of survey questions affect the accuracy of self-reported data a great deal. So, when inquiring into developers’ subjective experiences, you need to compose easy-to-comprehend questions and ensure absolute anonymity. Otherwise, your team members won’t be 100% honest with you and their responses won’t be on point.
3. Analyze your results to optimize developer productivity
Data analysis is about unveiling the hidden patterns of meaning in numbers and figures. There’s no single approach to doing it right – how you read and interpret the collected information will always depend on the unique context of your work, available resources, and the preferable level of accuracy you aim for. In either case, there is one sure way to make data analysis easier – it’s through data visualization.
There are plenty of open-source and commercial software products in the market helping users to connect a variety of data sources in one place and create well-organized visual graphics, maps, and charts. actiTIME is not an exception. Its handy reporting functionality includes beautiful visual charts and real-time widgets that depict your time tracking and performance results in a readable and super convenient format.
Explore all the data visualization features that actiTIME has to offer here. 👈
Conclusion
With the help of the SPACE Framework, developers can take back control of their productivity and become successful in their work. Prioritizing the five components of this framework – satisfaction and well-being, performance, activity, communication and collaboration, and efficiency – is a sure way to empower yourself and your team to do more with less.
In the end, the SPACE framework + the 15 metrics reviewed in this post give you a comprehensive set of tools for measuring and enhancing developer productivity – utilizing them is an absolute must-do in 2023. So, give them a go!