Keeping your budget in check can sometimes feel like wrestling with a grizzly bear. But thanks to budget variance analysis, it becomes so much easier to smooth out the bumps in your financial road.
Budget variance analysis shows where your financial plans diverge from reality and helps to understand where and why you’re spending more or saving less than planned.
Let’s see how to get back in charge of your budget with its help.
What Is Budget Variance Analysis?
Budget variance analysis is meant to solve the mystery of where and why differences occur between your planned budget figures and actual numbers. It’s that moment when you compare what you thought you were going to spend with what you actually spent and then dive into the reasons behind it.
Key Budget Variance Types
There are a few key budget variance types you should definitely know about. Each one tells its own story about what’s going on behind the numbers:
- Favorable variance. This is the one that puts a smile on everyone’s face. A favorable variance means actual revenues exceeded expectations or expenses were lower than planned. It’s like finding extra cash in your pocket. It suggests you’re either pulling in more business or managing costs like a champ.
- Unfavorable variance. This type occurs when actual revenues fall short of the budget or when expenses creep higher than anticipated. It signals the need to investigate further – perhaps unexpected costs or a downturn in sales are the culprits.
- Zero variance. This one is pretty rare – just like a budget unicorn. It’s when actual and budgeted numbers align perfectly, which could mean the budget was spot on, or it might hint at an area lacking in flexibility.
A Few Other Ways to Look at Your Budget Variance
When it comes to profit vs. loss analysis, there are several different factors you can focus on:
- Revenue variance. Here, the main focus is on your revenues. A favorable revenue variance indicates that you’ve earned more than planned. An unfavorable variance means you’re short on your goal, prompting you to revisit your sales strategies.
- Expense variance. This one is all about costs. A favorable expense variance occurs when you’ve spent less than budgeted. However, an unfavorable variance means you’ve shelled out more than expected, signaling it’s time to tighten those financial reins.
- Profit variance. This one measures the success of your budget by the difference between actual and projected profit. A positive variance means you’ve had a smashing financial performance, while a negative one calls for a sequel – maybe with more rigorous financial planning next time!
- Volume variance. This one is all about quantity. It arises when there’s a difference between expected and actual sales or production volumes. A volume variance can indicate shifts in consumer demand or production efficiency.
- Rate variance. The spotlight here is on cost per unit. A rate variance happens when the actual cost per unit differs from the standard cost. Maybe the cost of raw materials fluctuates or labor rates have changed.
How to Performance Budget Variance Analysis
Step 1: Gather your data
Get your hands on the actual figures of what was spent versus what was planned in the budget.
- Dive into your financial reports. Ledger entries or expense statements help to capture all the costs associated with your projects, keep tabs on your daily expenses, and track every penny to understand where the money flows.
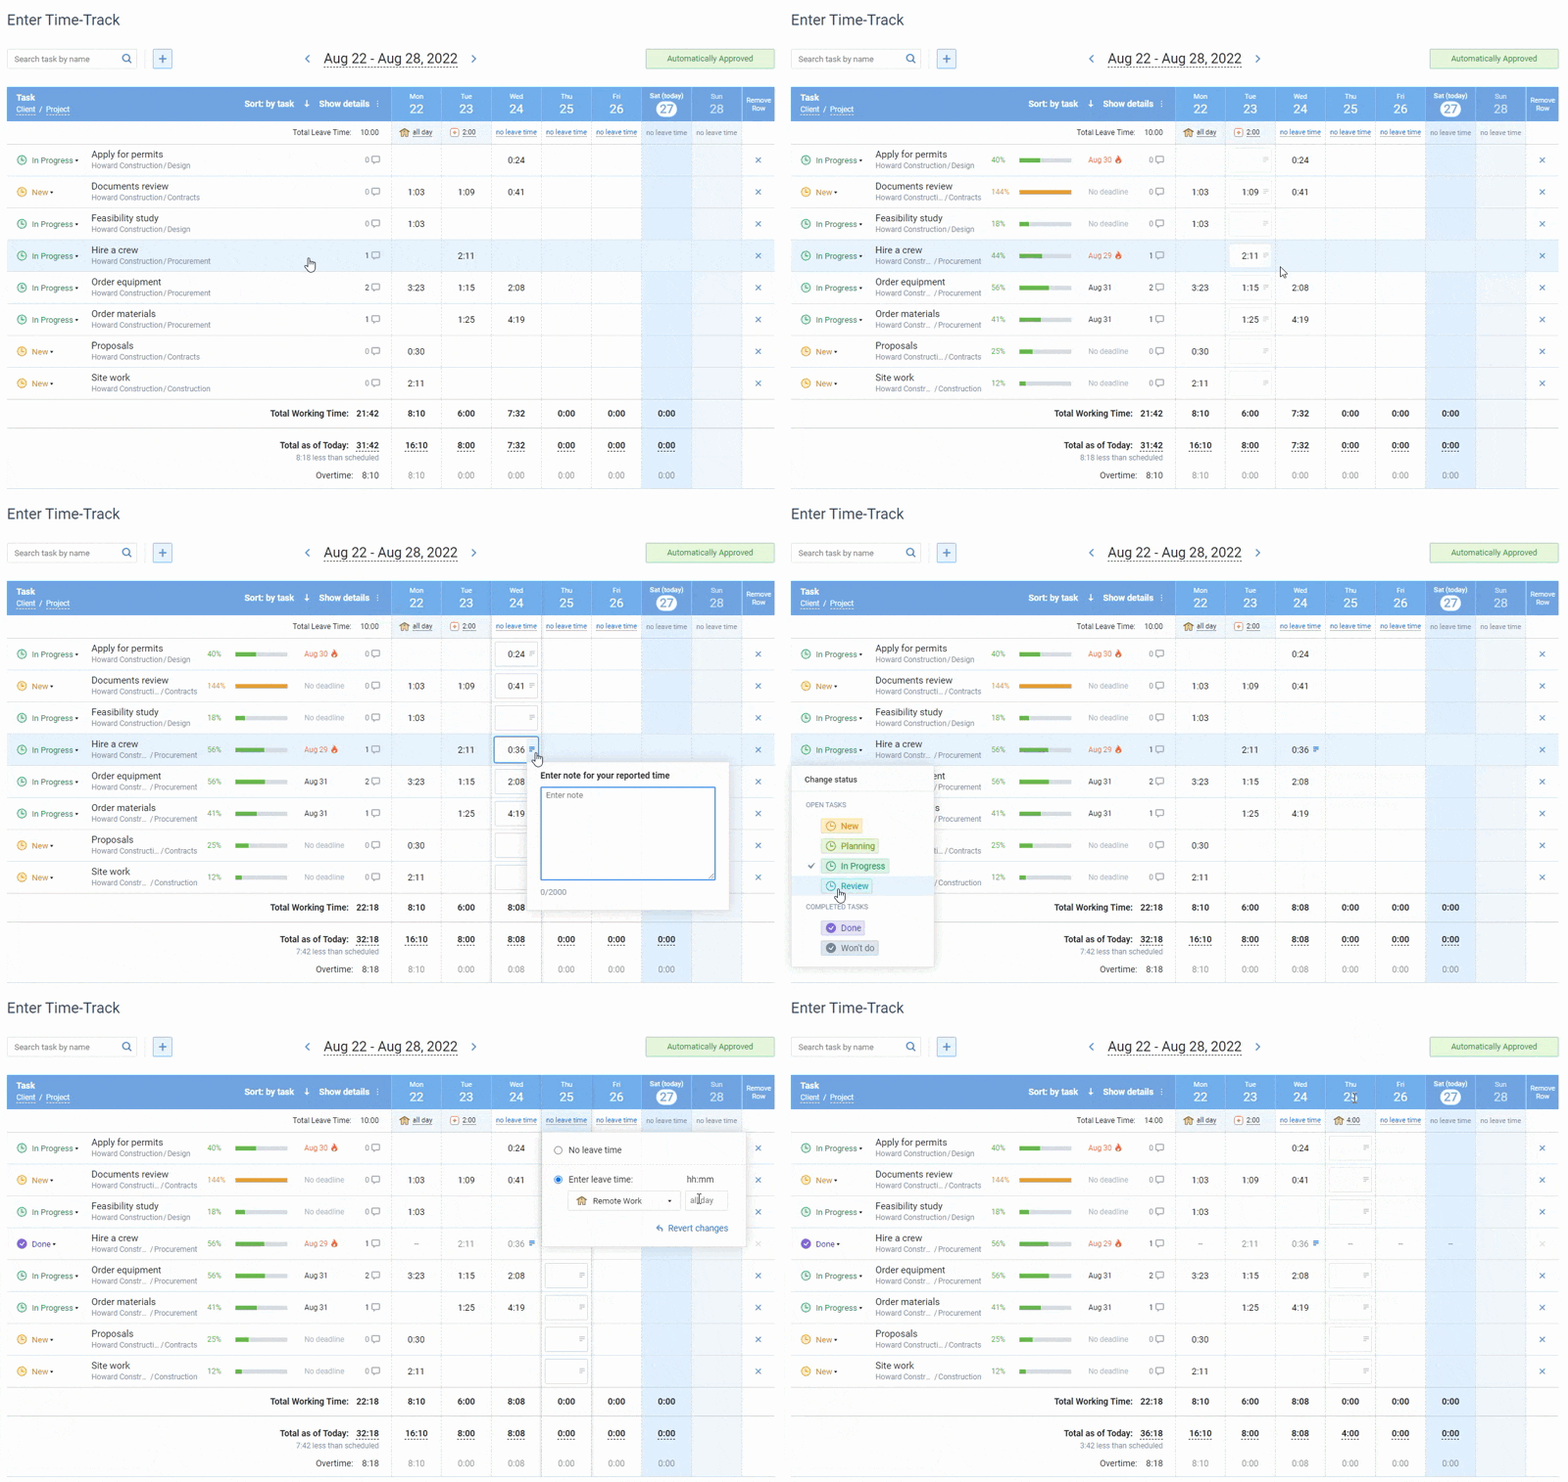
- Don’t skip over time tracking. It’s all about knowing how much time is being spent across different tasks and projects. This data is essential because it highlights productivity bottlenecks or areas where your team might be spending more hours than planned, impacting your costs.
- Use data from invoices, purchase orders, and payroll reports. Combining these different data streams provides a comprehensive picture of your financial health.
- Ensure your data gathering has regular checkpoints. Set a schedule to review and update your data, just like you would for any other important task.

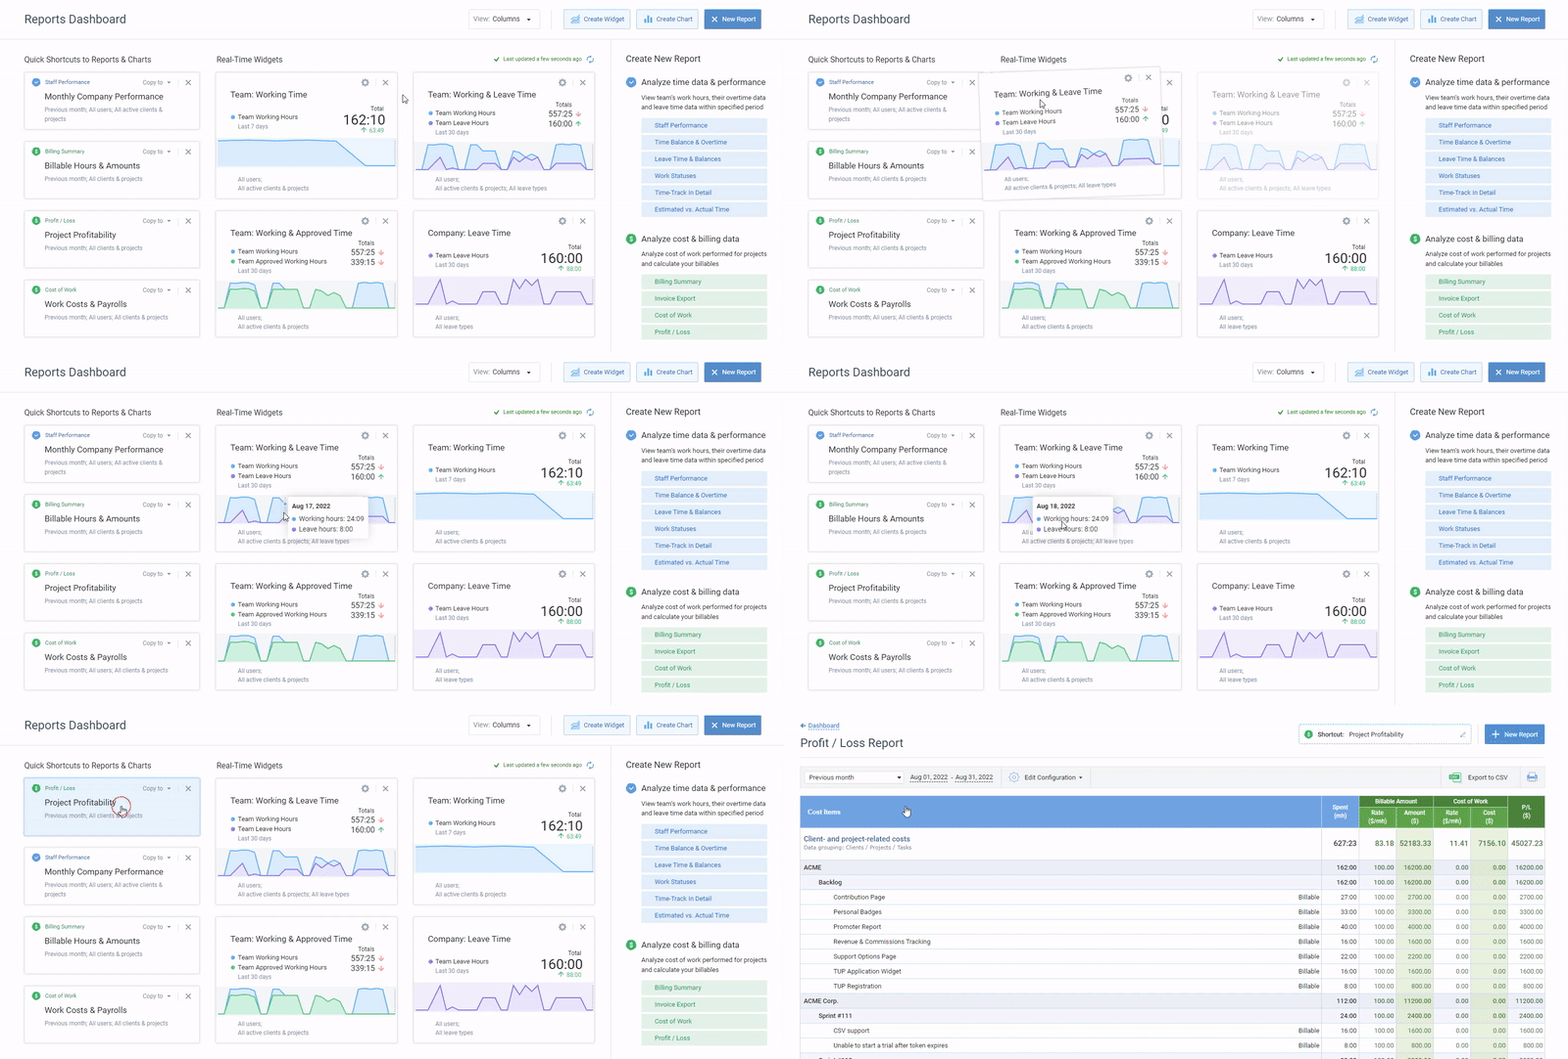
actiTIME offers comprehensive reports on project time, costs, and revenues. You can filter and organize this data in line with your needs to simplify your analysis process.
Step 2: Calculate the variance
Take each budgeted item and subtract it from the actual spent amount. If you’re looking at revenue, subtract the budgeted revenue from the actual revenue.
The formula is simple:
Each result will tell you if you’ve spent more or less than planned.
Pro tip:
Don’t want to waste your time calculating budget variance manually? Streamline the process using actiTIME!

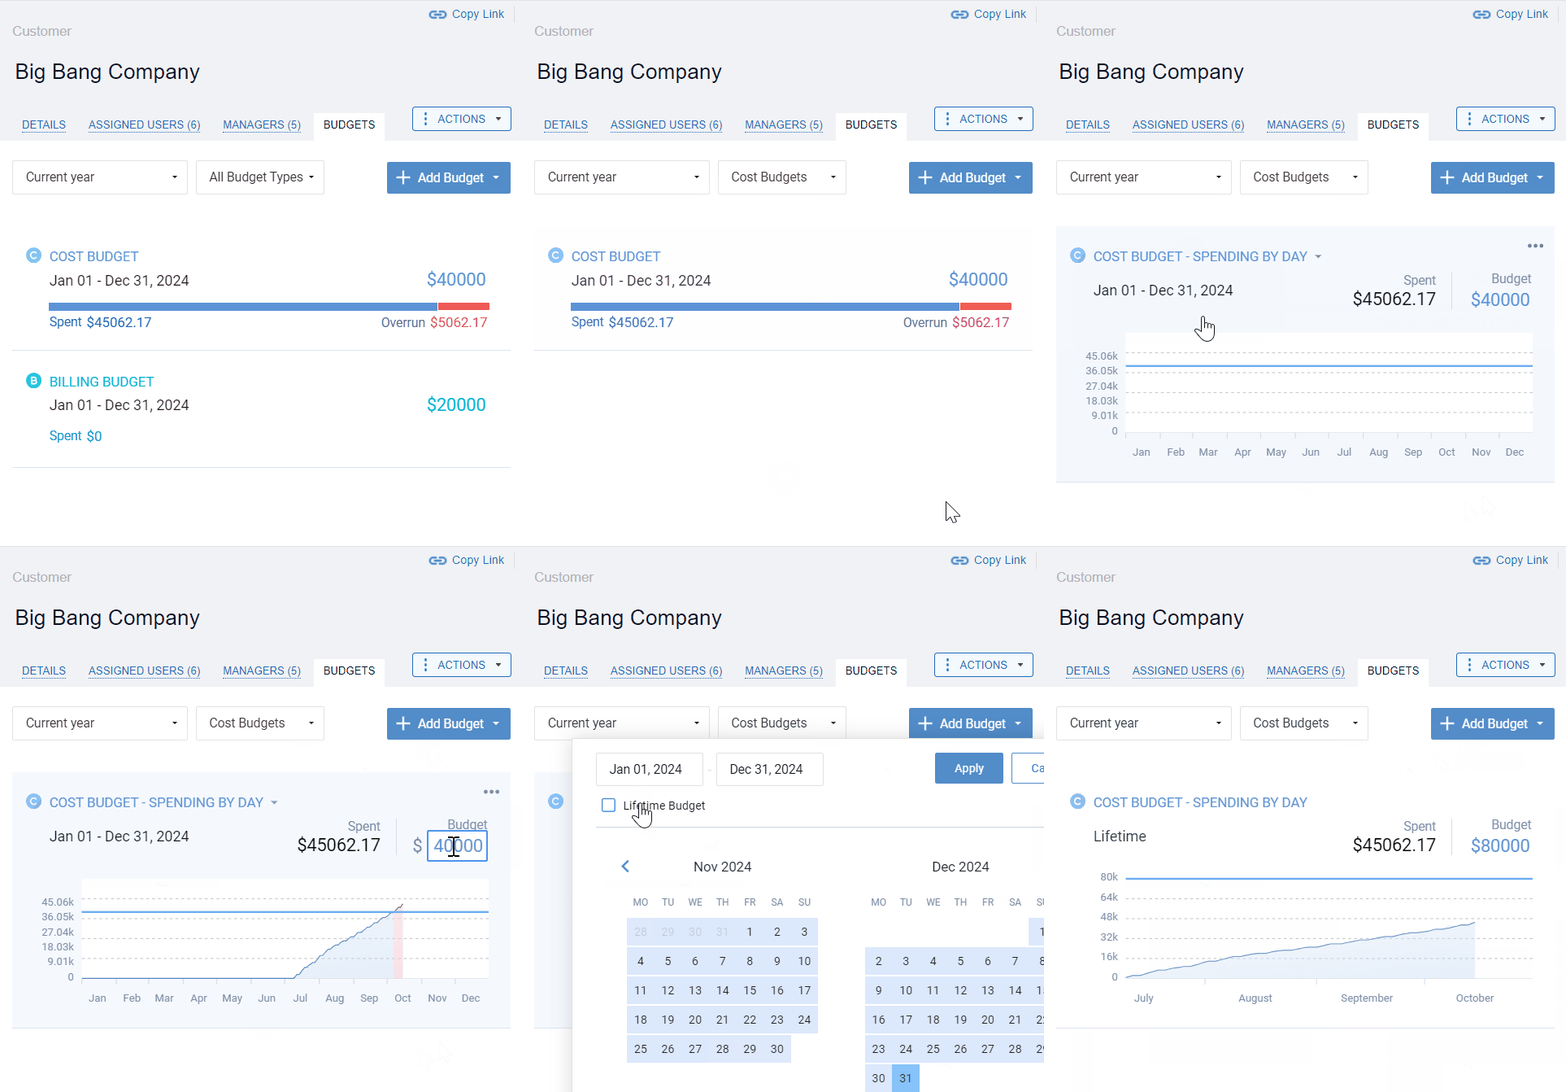
actiTIME lets you allocate three different types of budgets to either entire customers and projects or individual tasks:
- Time budgets help to control the use of time
- Cost budgets simplify the monitoring of staff-related expenses
- Billing budgets make it easy to stay within the sum your clients have agreed to pay for your work
Each of these budgets comes with a visual progress bar that clearly shows how you use your resources over time.
Whenever an overrun occurs, it highlights it in red and depicts the exact % of the amount you’ve exceeded. Plus, you can track your overall budget or break it down by days to get a more detailed picture.

Step 3: Categorize the variance
Before analyzing your data in depth, split your budget variances into two types: favorable and unfavorable.
As we already mentioned above, favorable variance occurs when your actual income is higher than expected or your expenses are lower. On the flip side, unfavorable variance is when costs skyrocket or revenue noses dive.
By categorizing variances in such a way, you get a clear picture of your financial health. This practice helps pinpoint areas where you’re doing well and where you might need to tighten the reigns. It basically serves as a diagnostic tool, letting you further trace back issues to root causes.

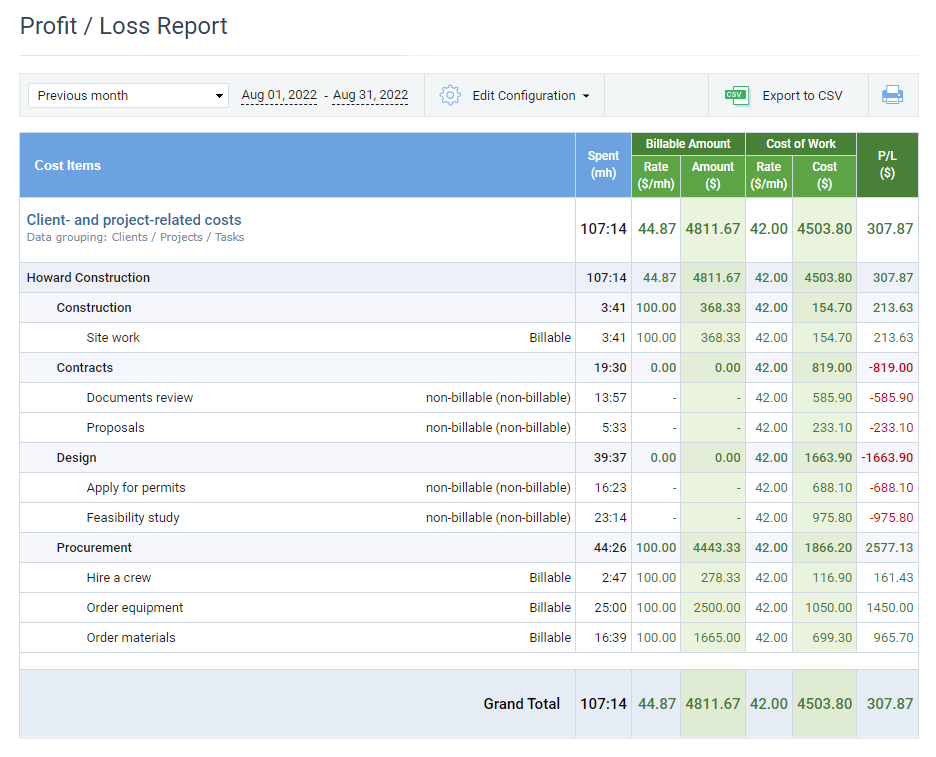
actiTIME calculates budget variances automatically and highlights the unfavorable ones in red to make it easier for you to organize the analysis process.
Step 4: Dive into the why
Here are a few methods that can help you get to the bottom of the numbers:
- Comparative analysis. Start by comparing actual expenses to your budgeted amounts. It’s like a financial detective work where you pinpoint where the differences lie. Look for over-spent and under-spent categories and try to determine what’s causing them. Was there a surprise expense or savings from a cost-cutting strategy that worked better than expected?
- Variance percentage. Calculate the variance percentage by dividing the variance by the budgeted amount and multiply by 100. This method gives you a sense of the variance’s impact. For example, a 2% variance might be negligible, but a 20% deviation demands attention.
- Categorical breakdown. Break down your budget into specific categories like rent, utilities, and supplies. Detailing variance in each category can help you spotlight specific areas that need more attention or tweaking.
- Trend analysis. Looking at your budget over time can also be enlightening. Spotting trends can illuminate seasonal expenses like winter heating costs or summer travel expenses affecting your bottom line. Trends can tell a story about recurring variances and help you adjust future budgets.
- Investigate causes. Once you’ve spotted a variance, dig deeper to uncover its cause. Did a new supplier raise their prices? Or were there unforeseen maintenance costs? Understanding “why” is key to preventing future variances.

actiTIME’s budget tracking feature streamlines the analysis process a great deal. It automatically compares your actual results to initial estimates, calculates variance percentages, and depicts trends over any period of time. The sole task left for you is to figure out the causes of occurring discrepancies and make plans for improvement.
Step 5: Make a plan for improvement
When facing an unfavorable budget variance, it’s time to roll up your sleeves and dive into a plan for improvement. Here’s how to tackle it expertly and effectively:
- Review and adjust projections. Once you know the reasons behind the unfavorable numbers, re-evaluate your estimates. Are they still realistic? Adjust them to reflect current conditions and set more attainable targets.
- Implement cost controls. Look for areas where you can trim the fat without compromising quality. This might involve renegotiating contracts, finding cheaper suppliers, or cutting non-essential expenses.
- Boost revenue. Get creative with strategies to increase income. Maybe it’s time for a special promotion, introducing a new product line, or tapping into a different market segment.
- Engage your team. Your team is your best asset. Encourage them to share ideas for improvement and keep them informed about changes. A motivated team can be pivotal in turning the situation around.
- Monitor progress. Set up a system to continuously monitor the financials and the impact of the changes you’ve made. This way, you can quickly adapt if things aren’t going as planned.
- Reflect and learn. Once you’ve managed to stabilize the situation, take time to reflect on what worked and what didn’t. This reflection is crucial for preventing similar issues in the future and ensuring long-term financial health.

From project time to hourly revenues, actiTIME empowers you to track a wide range of essential resources and monitor their use in real time. With its help, you can easily detect the risk of overspending and adjust your budgets promptly.
Budget Variance Analysis Example
Imagine you’re managing the budget for a small marketing campaign for a local bakery. Here’s how to analyze how your projections stack up against what actually happened:
- Setting the scene. First off, let’s pull together our budget. You’ve allocated $1,000 for social media ads, $500 for flyers, and another $500 for a launch event. This is our benchmark – your financial novel yet to unfold.
- Gather the facts. Post-campaign, it’s time to gather the actual data. Our detective work begins here. You spent $1,200 on social media ads (those boosted posts were irresistible!), $400 on flyers, and the launch event cost exactly what you’d planned at $500.
- The detective phase. Time to compare notes. For social media, your actual spend was $1,200 versus the budgeted $1,000. This gives you a variance of $200, over budget. Flyers saved you some cash, with a variance of $100 under budget. The launch event was spot on.
- Solve the mystery. Why were social media costs higher? Maybe your audience responded better than expected, justifying the extra spend. Understanding this is crucial to decide if these variances are one-off incidents or trend indicators.
- The big reveal. Finally, put it all together. These insights can guide future campaigns, helping to fine-tune your budget forecasts. By understanding what caused these variances, you’re empowered to make smarter financial decisions.
Budget Variance Analysis: Best Practices and Tips
- Make sure your budgets are realistic in the first place. Begin by thoroughly assessing your financial situation, including income, expenses, and any existing obligations. Avoid overestimating revenue or underestimating costs, as this may lead to shortfalls down the line. Consider historical financial data and use conservative estimates to create a balanced budget.
- Identify the key drivers. Look for the elements causing the biggest swings. Not every variance is worth your attention – focus on those that have a significant impact.
- Drill down into the data. Dig deeper into the line items affected by variance. Sometimes the devil is in the details, and uncovering small glitches in data can answer big questions.
- Use clear visuals. Charts and graphs can be worth a thousand spreadsheets. They help to quickly convey insights and trends, making your variance analysis both clearer and more digestible.
- Communicate with stakeholders. Don’t keep your findings to yourself. Discuss the analysis with relevant stakeholders to gain insights or clarify assumptions.
- Focus on actionable insights. It’s not just about identifying what went wrong – come up with plans to address the variances. Being proactive is key.
- Regular reviews and updates. Make variance analysis a routine practice, not a one-time event. Regular assessments ensure that you’re not just reacting but proactively managing the budget. Envision it as a fitness regimen for your financial health, keeping the budget in top shape all year round.
Why Is Budget Variance Analysis Important?
- Improved financial control. Budget variance analysis acts like a magnifying glass for your finances. It allows you to pinpoint where the cash is flowing in ways you didn’t see coming. This extra layer of scrutiny can help tighten those financial reins and keep the cash cow happy.
- Strategic decision making. By understanding where actual performance deviates from expectations, you can make more informed decisions. It’s like having a backstage pass to the financial rock show – ensuring you’re ready to hit all the right notes.
- Enhanced performance evaluations. Want to know who’s the superstar on your team? Regular analysis helps you see who’s hitting their targets and who’s just hitting the snooze button. It clarifies performance levels, allowing you to celebrate wins and address underperformance with concrete data.
- Flexibility and adaptability. Variance analysis provides the insights needed to adapt and pivot smoothly when things don’t go as planned.
- Boosts in accountability. By tracking variances, individuals and departments become more accountable for their financial operations. No more guessing games – numbers don’t lie, and having that truth on your side helps build a culture of responsibility and transparency.
Ready to simplify budget variance analysis, gain new clarity, and better control resources? Give actiTIME a try!


